Cloudiness Versus Latitude
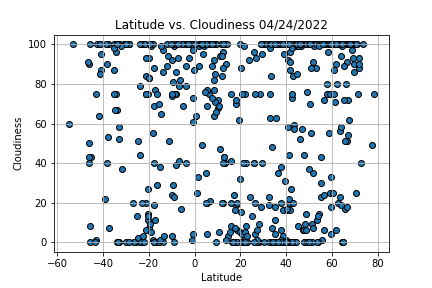
When observing this scatter plot, 0 represents the equator. There is no observable trend for cloudiness across the different latitudes. Level of cloudiness varies across all latitudes.
Last updated 04/24/2022

When observing this scatter plot, 0 represents the equator. There is no observable trend for cloudiness across the different latitudes. Level of cloudiness varies across all latitudes.
Last updated 04/24/2022
This website was created by Hannah Allen
Git Hub Linkedin